What is R Programming?
R is a programming language and environment commonly used in statistical computing, data analytics and scientific research.
It is one of the most popular languages used by statisticians, data analysts, researchers and marketers to retrieve, clean, analyze, visualize and present data.
Data analysis with R is done in a series of steps; programming, transforming, discovering, modeling and communicate the results.
- Program: R is a clear and accessible programming tool
- Transform: R is made up of a collection of libraries designed specifically for data science
- Discover: Investigate the data, refine your hypothesis and analyze them
- Model: R provides a wide array of tools to capture the right model for your data
- Communicate: Integrate codes, graphs, and outputs to a report with R Markdown or build Shiny apps to share with the world
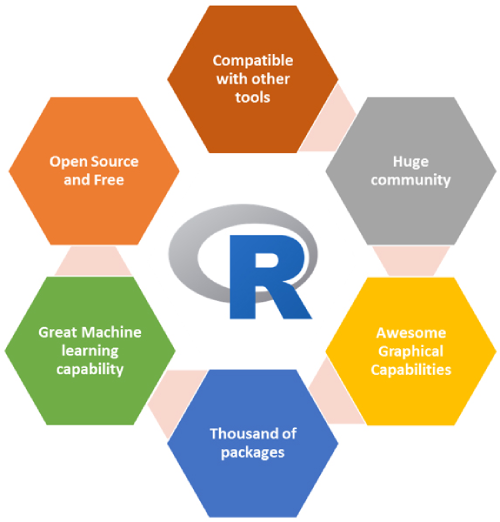
Why use R for statistical computing and graphics?
- R is open source and free!
- R is popular – and increasing in popularity
- R runs on all platforms
- Learning R will increase your chances of getting a job
- R is being used by the biggest tech giants
Shasta in R Programming
We started off using R for its ease of transforming the tabular data in graphical form. Further research is on using the statistical analysis part to help practical challenges faced by the industry on the unknowns. With our foray into Big data, R is expected to be a key for real-time streaming analysis from sources such as sensors, log files, geospatial services. This is expected to provide notifications to the stakeholders based on the user-defined thresholds.

