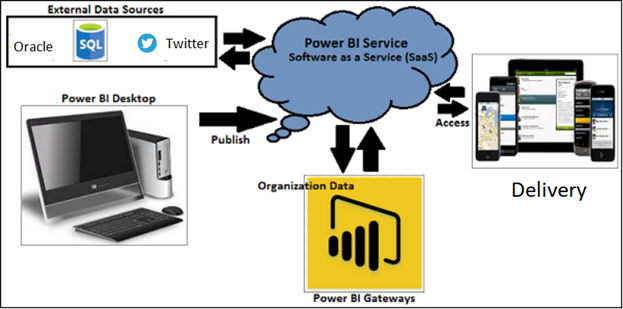
Power BI is a business analytics service that delivers insights to enable fast, informed decisions.
- Transform data into stunning visuals and share them with colleagues on any device.
- Visually explore and analyze data—on-premises and in the cloud—all in one view.
- Collaborate on and share customized dashboards and interactive reports.
- Scale across your organization with built-in governance and security.
Shasta used this tool to visualize the Streaming data for Sentiment Analysis, With the help of Sentiment analysis we can get the how many tweets got POSITIVE, NEGATIVE and etc. status against the twitter Tags. Total number of created tweets can be analyze using this tool.


